
Meta description: Zendesk costs keep rising, but you can’t see who owns them. Learn chargeback vs showback and use showback to find license waste before renewal.
Your Zendesk invoice lands, finance asks why it went up, and nobody has a clean answer.
Support says they need every seat. Ops says some agents only log in occasionally. IT can see the user list in Zendesk Admin Center, but that still doesn’t tell you which department is carrying unused licenses, who should own the spend, or what should change before renewal. Looking at the total bill won’t fix that.
Most chargeback vs showback articles talk about cloud compute. That’s useful, but it skips a very real SaaS problem. Unused agent licenses. According to Finout’s write-up on showback complexity, unused licenses can represent 30-40% wasted spend, and Gartner reports 35% of SaaS spend is wasted on unused licenses globally.
That’s why Zendesk needs its own cost allocation discussion. A seat-based tool behaves differently from metered infrastructure. You’re not tracking CPU spikes. You’re tracking named agents, plan tiers, department ownership, and whether people are active enough to justify the seat. If you’re still auditing that with exports and spreadsheets, a good license auditing software process usually matters more than another budget meeting.
Your Zendesk Bill Is Growing But Why
A common pattern shows up in mid-market teams. Zendesk starts in one department, then spreads. Support adds managers. Sales wants light access. Success asks for a few seats. Contractors stay provisioned after a project ends. The invoice grows, but the ownership model never catches up.
What you end up with is a shared SaaS bill and fuzzy accountability. Finance sees one vendor. Department heads see “an IT tool.” Admins see users in Zendesk. Nobody sees a clean breakdown of which team is driving cost, which seats are idle, and where waste is sitting.
The SaaS gap most teams miss
Cloud cost allocation is built around usage meters. Zendesk is different. Your cost usually moves with agent count and plan mix, not per-minute consumption. That changes the kind of waste you need to find.
A few examples:
- Dormant seats: Former team members or occasional users still hold paid licenses.
- Wrong ownership: An agent belongs to Support on paper, but another team requested the seat.
- Over-tiering: A user sits on a higher plan than their day-to-day work requires.
- Shared budget confusion: One central owner pays while several departments consume.
Showback works well when your first problem is visibility, not enforcement.
If you can’t tie Zendesk seats to the right team first, chargeback will create arguments. Start with attribution. Then decide whether you want reporting only or actual internal billing.
Defining Showback and Chargeback
Showback is a reporting model. You calculate each department’s share of the Zendesk bill and show them the number, but you don’t move money between budgets.
For Zendesk, that usually means a monthly report by department, business unit, or cost center. Support might see its total for Suite Professional seats. Sales might see its total for lighter access. The report is informational. It tells each team, “Here’s what your Zendesk footprint costs.”
Chargeback is an accounting model. You take that same allocation logic and use it for an actual internal cost transfer. The department doesn’t just see the amount. The amount hits its budget.
Why both models exist
Chargeback had been the dominant model since the early 2000s. Around 2010, showback emerged as a modern alternative because teams wanted cost visibility without the friction and admin burden of direct billing, as summarized in Wikipedia’s overview of IT chargeback and showback. The same source also notes the FinOps Foundation’s position that neither model is more mature in itself. The right choice depends on your context.
That matters for Zendesk admins because there’s a temptation to think chargeback is the “grown-up” option. It isn’t always. If your user data is messy, your department mapping is incomplete, or your finance team doesn’t want to restructure internal billing, chargeback is the wrong first move.
A practical Zendesk definition
Here’s the working version I’d give a new Ops Manager.
| Model | What you do with Zendesk costs | What department heads see | Budget impact |
|---|---|---|---|
| Showback | Allocate seat costs by department and publish a report | Their team’s monthly Zendesk cost, seat counts, and waste | None |
| Chargeback | Allocate seat costs by department and post them to internal budgets | The same detail, plus an internal bill or transfer | Direct |
The real difference
Showback informs. Chargeback invoices.
That sounds minor, but it changes the tone of every conversation. Showback says, “Here’s your usage and your share.” Chargeback says, “Here’s your bill.” For SaaS license management, especially in Zendesk, that difference often determines whether department leaders engage with the data or start disputing it.
Chargeback vs Showback A Detailed Comparison
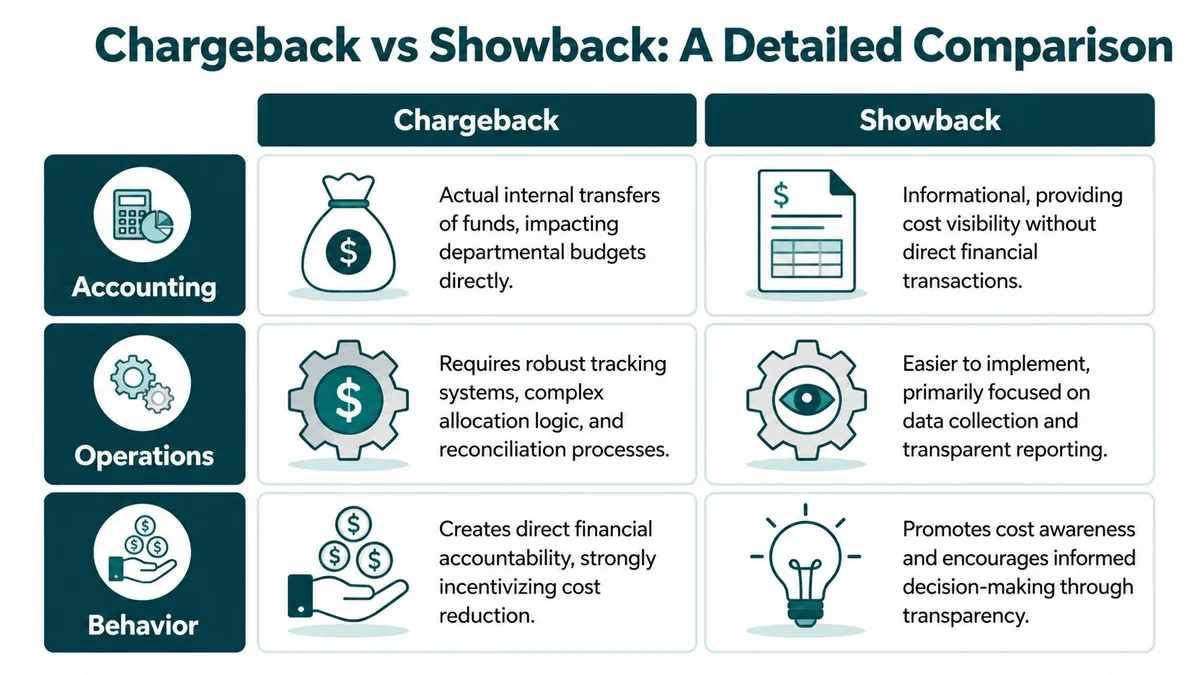
If you’re evaluating chargeback vs showback for Zendesk, compare them in three areas. Accounting, operations, and behavior. That’s where the trade-offs show up.
| Category | Showback | Chargeback |
|---|---|---|
| Accounting | Reporting only | Internal billing or budget transfer |
| Operational lift | Lower, based on reporting and attribution | Higher, needs reconciliation and finance process |
| Data standard | Good enough for directional visibility | Must be precise enough to survive disputes |
| Department reaction | Awareness and discussion | Immediate budget pressure |
| Best first use in Zendesk | Finding idle seats and ownership gaps | Recovering costs from teams with clear budget ownership |
Accounting changes the stakes
With showback, your Zendesk admin or IT finance analyst can publish a report that says Support owns one set of seats and Sales owns another. The data creates transparency, but finance still pays Zendesk centrally.
With chargeback, that same report becomes the basis for internal cost allocation. If Support carries a larger agent footprint, Support’s budget absorbs it. Once that happens, every disputed seat becomes a finance issue, not just an admin cleanup task.
Operations decide how painful rollout will be
Chargeback needs more than a spreadsheet. You need repeatable allocation rules, a finance-approved mapping to cost centers, and a reconciliation process when someone disputes a user assignment.
Showback can start much earlier. If you can reliably map agents to departments and plan tiers, you can produce useful reports without changing your accounting system.
A practical Zendesk example:
- Showback workflow: Export users, map each agent to department, apply plan cost, share the report monthly.
- Chargeback workflow: Do all of the above, then feed the result into internal billing or budget journals and handle exceptions.
Practical rule: If you can’t explain every allocated seat to a department head in one meeting, you’re not ready for chargeback.
Behavior is where the models really separate
The biggest difference isn’t technical. It’s behavioral.
As Splunk’s comparison of chargeback and showback puts it, chargeback creates strong incentives because there are direct financial consequences, while showback creates medium-level pressure through visibility alone. Their example uses a $10,000 monthly compute cost. Under showback, a leader sees the number and may ask for more efficient use. Under chargeback, that $10,000 is deducted from the department’s budget.
For Zendesk, the same pattern applies even though the cost driver is seats instead of compute. A department head who sees idle agent licenses in a showback report may agree to clean them up. A department head facing a chargeback will push much harder, but they’ll also challenge every edge case.
What tends to work in practice
Showback usually works better first when:
- Ownership is blurry: Seats have grown across teams without a cost model.
- Data is uneven: User-to-department mapping still needs cleanup.
- You need cooperation: You want leaders to engage without feeling punished.
Chargeback usually works better when:
- Budgets are decentralized: Department leaders already own software spend.
- Allocation is trusted: Everyone accepts who owns which seats.
- Finance wants recovery: The business needs formal cost accountability.
How to Choose the Right Model for Your Team
Most Zendesk teams should start with showback.
That’s not because chargeback is wrong. It’s because bad chargeback does more damage than useful showback. If your seat ownership data is shaky, your department list changes every quarter, or your admins still clean up users manually, you’ll spend more time defending numbers than reducing waste.
Start with your data, not your policy
The best decision test is boring. Can you confidently answer these questions every month?
- Seat ownership: Which department owns each Zendesk agent?
- Plan mapping: Which users are on which Zendesk tier?
- Exception handling: How do you treat shared admins, contractors, and temporary users?
- Reporting cadence: Who reviews the numbers, and when?
If any of those are unclear, use showback first. Build the reporting habit. Fix your mapping. Then revisit chargeback later.
A related point matters here. Chargeback depends on trust. According to Serviceware’s summary of FinOps billing models, a 2025 FinOps Foundation survey found 42% of chargeback implementations fail because of immature tagging and internal disputes, compared with 15% for organizations that start with showback.
A useful middle ground
A hybrid model often fits Zendesk better than an all-or-nothing choice.
You can show back every seat and only charge back the costs that are easy to defend. For example, you might keep central ownership for shared admin overhead but charge departments for clearly assigned agent seats. That lowers friction while still creating some financial accountability.
If your first report triggers arguments about ownership, pause the billing step. Fix the mapping first.
Pick the model that matches your budget culture
A few common fits:
| Your environment | Better starting model |
|---|---|
| Central IT budget, weak seat ownership, low trust in data | Showback |
| Department budgets are mature and leaders already own software costs | Chargeback |
| Clear ownership for some users, shared ownership for others | Hybrid |
If you’re still cleaning up SaaS spend across the business, broader business spending management practices usually support showback well. You get visibility without forcing finance process changes before the data is ready.
A 5-Step Checklist to Implement Zendesk Showback
You don’t need perfect data to start showback. You need data that’s good enough to support a fair conversation.
That’s the key difference between Zendesk showback and chargeback. As ProsperOps explains in its comparison, chargeback demands much higher precision, including per-user activity metrics to avoid billing disputes. Showback can work with less granular inputs, such as departmental agent counts.
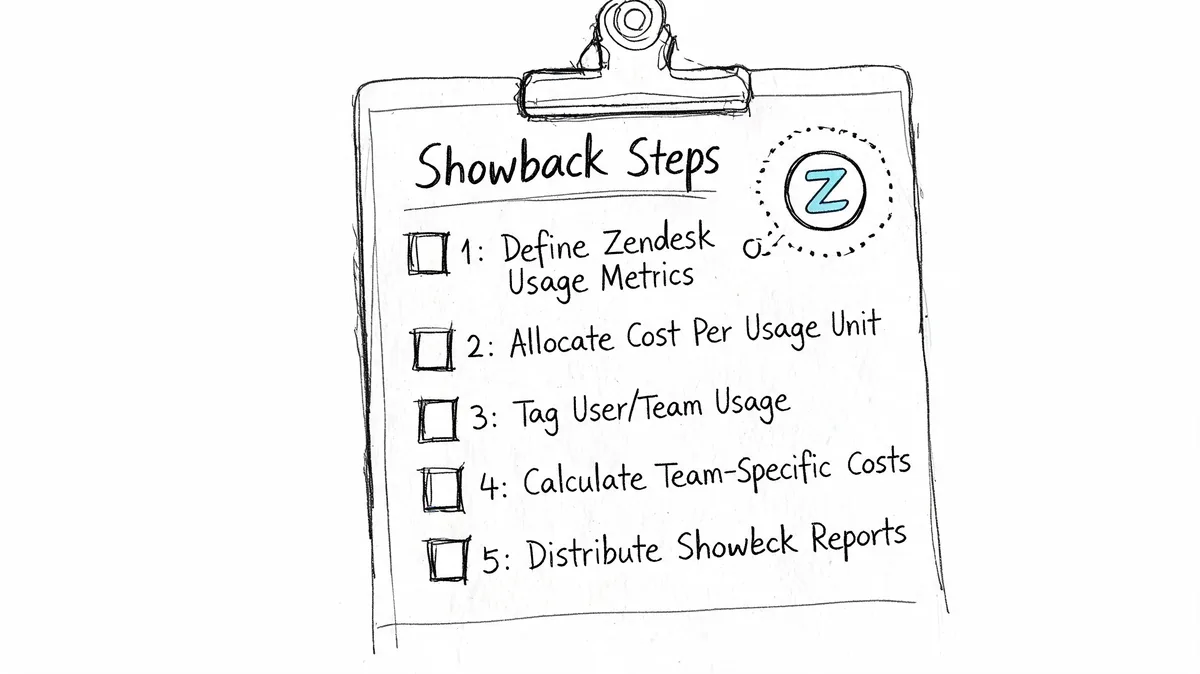
1. Map every paid agent to an owner
Don’t start with activity logs. Start with ownership.
For each Zendesk agent, assign one clear owner. Usually that’s a department, cost center, or manager. If a user account sits in a gray area, mark it as an exception and resolve it before sending reports.
2. Apply the right plan price to each seat
Zendesk pricing gives you a clean baseline for showback. Use current annual-billing rates:
| Zendesk plan | Cost per agent per month |
|---|---|
| Suite Team | $55 |
| Growth | $89 |
| Professional | $115 |
| Enterprise | $169+ |
If your contract has negotiated pricing, use your contract instead. What matters is consistency. Every report should use the same rate card.
3. Flag seats that look inactive or misassigned
Addressing these areas yields the most value. Look for users who remain licensed but don’t appear active enough to justify the cost. Also flag users on the wrong team, duplicate provisioning, and seats assigned for “temporary” work that never ended.
Some teams do this manually from exports. Others use Zendesk API data to review activity with more confidence.
4. Send one report per department head
Keep the report small enough that someone will read it.
Include:
- Current seat count: Paid agents assigned to the department.
- Plan mix: Who is on Suite Team, Growth, Professional, or Enterprise.
- Monthly cost: The amount attributed to that department.
- Review flags: Inactive, duplicate, or questionable seats.
Operational advice: Showback reports should create one decision per flagged seat. Keep, downgrade, reassign, or remove.
5. Review the report live
Email alone won’t do much. Book a short review with each owner. Walk through the exceptions and get decisions while the context is fresh.
That meeting is where showback earns its keep. You’re not accusing anyone of waste. You’re making the Zendesk bill explainable.
Sample Calculation and Governance Template
A showback report should look boring. That’s a good sign. If the numbers are easy to follow, department heads are more likely to accept them and act.
Sample Zendesk Showback Report Monthly Cost
| Department | License Tier | Agent Count | Cost Per Agent/Mo | Department Total |
|---|---|---|---|---|
| Support | Professional | 20 | $115 | $2,300 |
| Sales | Suite Team | 5 | $55 | $275 |
That table is enough to start a real conversation. Support can review whether all 20 Professional seats are still needed. Sales can confirm whether all five Suite Team users still need agent access.
A lightweight governance note
Add a short policy note to every report. Keep it consistent.
Monthly Zendesk showback reports are for cost visibility and cleanup, not blame. Department heads review assigned agents, confirm ownership, and flag inactive or misassigned seats. IT owns the source data. Finance owns the reporting cadence. Any disputed user stays in review until ownership is confirmed.
That language matters. Without it, reports can turn into finger-pointing. With it, you frame the process as governance, not punishment.
If you’re formalizing this across more tools than Zendesk, broader SaaS governance best practices help keep ownership rules consistent across apps.
What to Do Before Your Next Zendesk Renewal
Don’t wait for renewal week to sort this out.
If you’re deciding between chargeback vs showback, start with showback now. It’s the faster way to answer the questions that affect your Zendesk budget. Who owns each seat. Which departments are driving cost. Which licenses look idle. Which plan assignments no longer make sense.
You can build that first report with exports and manual review if you have time. Few teams have that luxury. They need a current snapshot before finance locks another term.
The practical next step is a quick audit of inactive and underused Zendesk agents. That gives you a usable baseline for department-level showback, and it gives you something concrete to act on before renewal conversations start.
If you want the fastest way to get that baseline, LicenseTrim connects to Zendesk via OAuth, finds inactive agents, and shows the money tied up in unused licenses. It’s a practical way to build your first showback report around real seat usage instead of assumptions.