Meta description: Zendesk costs keep rising when inactive seats hide in plain sight. Track the right application portfolio management metrics and cut SaaS waste.
Finance forwards the Zendesk renewal. The note is short.
You see the question every Ops or IT lead dreads: why is this bill going up, and are we using all these seats?
You probably have a rough answer. A few agents changed teams. Some contractors rolled off. A couple of light users still have full licenses because nobody wants to break support coverage. The problem is that “roughly” doesn’t help when the invoice lands.
That’s where application portfolio management metrics stop being enterprise jargon and start being useful. You need numbers that tell you which tools earn their keep, which ones bleed money, and which ones look idle but are still tied to a real business need.
Zendesk is a good place to start because the waste is usually visible once you know where to look. If your renewal feels bigger every year, this Zendesk cost breakdown is a good companion read.
That Zendesk Bill Is Climbing Again
A mid-market team usually doesn’t have an “application portfolio.” It has a pile of tools people bought to solve real problems.
Support uses Zendesk. Success added a survey tool. Sales brought in its own scheduler. HR has a learning platform. Marketing has three subscriptions nobody in IT approved. Then finance asks for one clean number and one clear answer.
The real problem isn't the invoice
The invoice is just the moment the problem becomes visible.
Many organizations can tell you what Zendesk costs per agent. Fewer can tell you:
- Who is active: not just enabled in Admin Center, but doing meaningful work
- Which tier fits: full agent, light user, or someone who no longer needs access
- What overlaps exist: when another tool handles work Zendesk already covers
- What changed: hires, exits, org changes, and temporary projects that became permanent spend
Without those metrics, the renewal discussion turns into opinions. Support says every seat might be needed. Finance says the total looks wrong. IT ends up in the middle, digging through exports and trying not to remove access from the one person who still handles escalations on Fridays.
Practical rule: If you can’t show usage, cost, and owner for a SaaS app, you’re not managing it. You’re renewing it.
Why Zendesk exposes the gap fast
Zendesk is operational software. It’s tied to tickets, workflows, SLAs, and staffing. That makes it easier to spot waste than in a broad productivity suite, but only if you track the right things.
A named agent who rarely logs in may still be needed. Another may sign in often but do almost nothing. A third may have left months ago and still be billable. Those are different cases, and they need different actions.
That’s why the best APM work starts small. Don’t begin with every app in the company. Start with the tools that hit your budget every month and are painful to audit manually. Zendesk almost always qualifies.
What Is Application Portfolio Management?
Three weeks before a Zendesk renewal, the usual questions hit at once. Finance wants a number it can defend. Support wants to avoid breaking coverage. IT needs to sort active users from leftover seats, overlapping tools, and old configuration decisions that nobody documented.
Application portfolio management gives you a way to do that without turning the exercise into a long architecture project.
At the mid-market level, APM is simple. Keep a current inventory of business apps, assign ownership, and use a standard method to decide what to do with each one. The goal is not to admire the spreadsheet. The goal is to make better keep, improve, replace, and retire decisions before money goes out the door.
That matters most with SaaS tools like Zendesk because the waste is rarely dramatic. It shows up as small, repeated charges, extra add-ons, higher tiers than the role needs, and licenses that survive org changes. One unused seat is noise. Fifty across the stack is budget.
Inventory is only the starting point
A list of applications, owners, and contract dates is useful, but it does not qualify as APM by itself. APM starts working when every app on that list has an expected action tied to evidence.
The TIME model is still one of the easiest ways to keep those decisions consistent:
| Category | What it means | Zendesk example |
|---|---|---|
| Tolerate | Keep it as is for now | Zendesk supports the service desk well, adoption is stable, and there is no strong business case to change it this quarter |
| Invest | Keep it and improve it | Zendesk is a core system, but the instance needs cleaner groups, better triggers, or a tighter license mix |
| Migrate | Move to a better fit | Zendesk is being stretched into use cases another platform handles better, or you are consolidating a fragmented support stack |
| Eliminate | Retire or remove | Old add-ons, duplicate tools, and licenses with no clear owner or business use |
For a broader view of how teams structure these decisions, this guide on application portfolio management solutions is useful.
Why mid-market teams need APM sooner than they think
Large enterprises made APM popular, but the discipline often pays back faster in mid-market environments. Smaller IT teams have less room to absorb bad renewals, unclear ownership, or duplicate SaaS purchases. They also tend to inherit tools department by department, which creates a portfolio that grew without a shared standard.
Zendesk is a good example. It may start as a support platform, then pick up chat, knowledge base, workflow automation, and reporting responsibilities. Over time, you also find another inbox tool, a survey app, a chatbot add-on, or a spreadsheet process that overlaps with work Zendesk already covers. APM helps separate what is essential from what was never cleaned up.
What good APM looks like in practice
The teams that get value from APM keep the process boring and repeatable.
What works:
- Start with apps that renew soon or cost enough to matter
- Assign one accountable owner for each app
- Use a small scorecard with cost, usage, business fit, and risk
- Review quarterly so cleanup happens before renewal pressure hits
- Check granular license utilization, not just whether a user exists in the admin panel
What fails:
- Building a giant inventory before making any decisions
- Letting ownership sit with a committee instead of a named person
- Using vendor login counts as the only proof of value
- Treating every low-usage app as waste without checking business context
The practical test is straightforward. If the team can explain why Zendesk stays, which tier each user needs, and what would happen if spend had to drop by 10 percent, APM is working. If renewal still depends on opinions and last-minute exports, it is not.
Financial Metrics TCO and Cost vs Value
Many organizations start with license price because it’s visible. That’s fine, but it’s incomplete.
For Zendesk, the annual billing rates the brief provided are Suite Team $55, Growth $89, Professional $115, Enterprise $169+ per agent/month. If you stop there, you’ll underestimate what the app really costs and overestimate how hard it is to defend.
TCO starts with the bill and keeps going
Total cost of ownership (TCO) for SaaS should include the obvious and the annoying.
For Zendesk, that usually means:
- License fees: your per-agent subscription
- Admin time: user management, groups, routing, audits
- Implementation work: setup, migration, and integrations
- Training: onboarding new agents and managers
- Support overhead: internal troubleshooting and process cleanup
Here’s a basic example.
| Cost Component | Calculation | Estimated Annual Cost |
|---|---|---|
| Zendesk licenses | 10 agents × $115/month × 12 months | $13,800 |
| Initial setup or changes | Qualitative, depends on your environment | Varies |
| Admin overhead | Qualitative, depends on how often you review users and workflows | Varies |
| Training time | Qualitative, depends on turnover and process complexity | Varies |
| Integration upkeep | Qualitative, depends on connected systems and custom apps | Varies |
If you want a wider lens on hidden software spend, this breakdown of SaaS cost categories is worth reading.
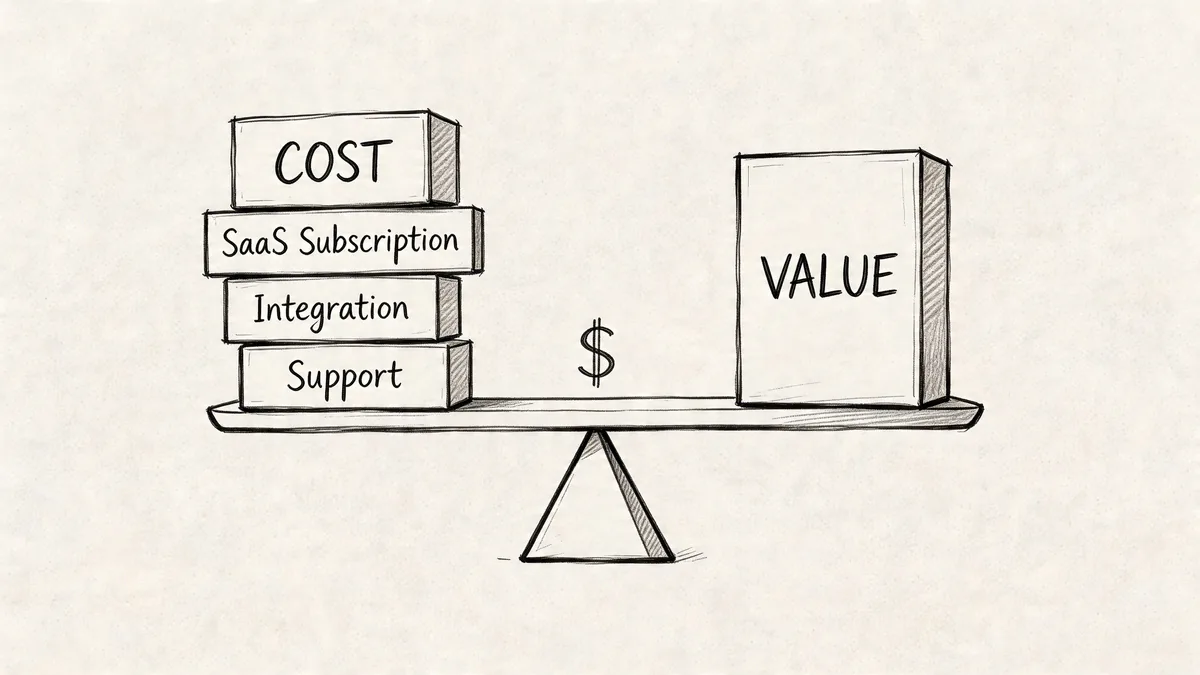
Cost vs value is where finance pays attention
The sharper metric is application cost vs business value.
An app can be expensive and still be a great buy. Zendesk often is. The issue is paying premium-level money for weak adoption, poor workflows, or seats that no longer match actual use.
According to Faddom’s summary of application portfolio management metrics, applications with poor cost-to-value ratios can drain 20-30% of IT budgets. The same source cites a 2022 McKinsey analysis showing 40% of enterprise portfolios had apps costing over $100K/year while contributing less than 10% to revenue, and rationalization yielded 25% cost reductions.
Use a four-box matrix, not a debate
A cost-value matrix is one of the few APM tools that works equally well with IT, support leaders, and finance.
| Quadrant | What you do |
|---|---|
| High cost, high value | Protect it. Improve admin, controls, and fit |
| Low cost, high value | Keep it. Don’t over-process it |
| Low cost, low value | Watch it. Combine or retire when practical |
| High cost, low value | Act on it fast. Reduce licenses, replace, or remove |
Zendesk usually belongs in high cost, high value. But parts of your Zendesk footprint may not. Extra agent seats, unused add-ons, and old sandbox habits can push pieces of the spend into high cost, low value.
What teams often get wrong
They judge value by how loudly a team asks to keep a tool.
That’s not value. That’s internal politics.
A better approach is to score value using a few grounded prompts:
- Revenue support: does the app directly support customer retention or service delivery
- Workflow dependence: would work stop or degrade without it
- Replacement effort: can another approved tool already do the job
- User depth: are people using core features or just basic access
When you bring that score next to actual cost, weak renewals get hard to defend.
Usage Metrics The Most Important Numbers You Aren't Tracking
For SaaS, usage usually tells the truth faster than any other metric.
You can keep an expensive app with confidence if people use it in a way that maps to real work. You should challenge it when the seat count stays flat but active use drifts down, or when users have access long after their role changed.
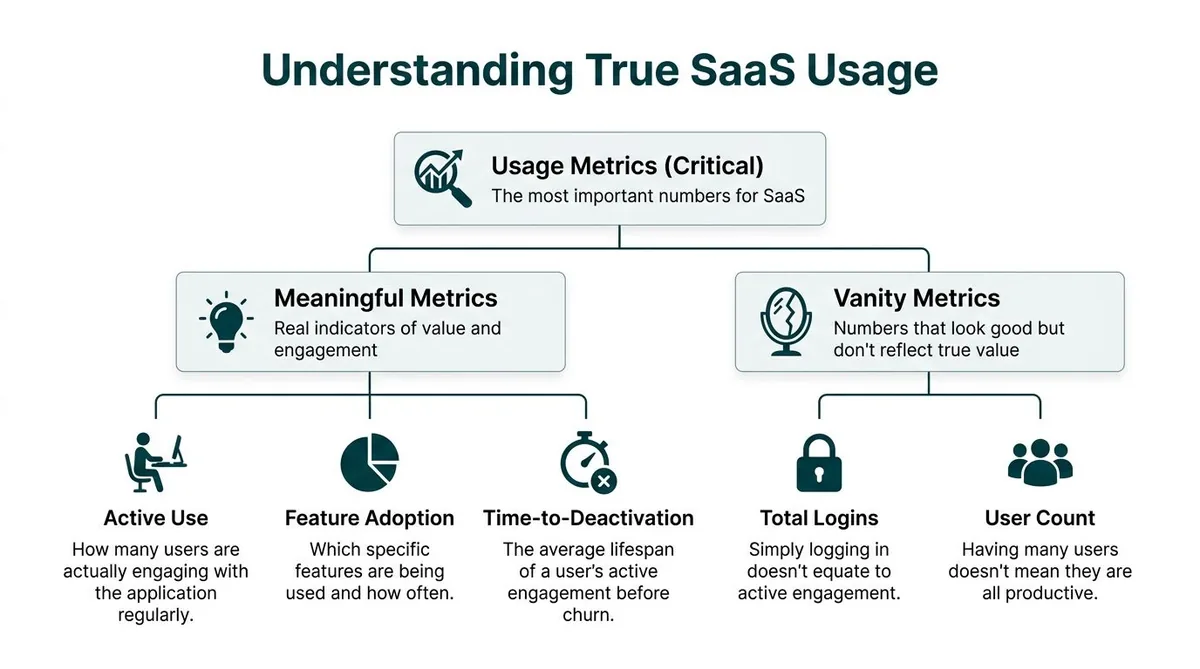
Stop trusting vanity metrics
Login count is easy to pull. It’s also one of the easiest ways to fool yourself.
A support manager can point to a user list and say everyone logged in recently. That still doesn’t tell you whether those people handled tickets, used key features, or needed a paid seat at all.
The usage metrics worth tracking look more like this:
| Metric type | What it tells you | Why it matters in Zendesk |
|---|---|---|
| Active use | Who is doing regular work | Flags paid agents who aren’t really active |
| Feature adoption | Which parts of the product matter | Shows whether you’re paying for depth or just access |
| Time-to-deactivation | How long a user stays active before going idle | Helps catch role changes and stale seats |
| Total logins | Who signed in | Weak on its own |
| User count | How many accounts exist | Useful for inventory, weak for value |
Manual tracking breaks down fast
The usual process is ugly.
You export users. You pull last login or activity data. You compare it against your HR roster or a support org chart. Then you clean the spreadsheet, ask managers for exceptions, and repeat the process right before renewal when everyone is busy.
It works, but not well.
The bigger problem isn’t effort. It’s confidence. Manual checks often miss edge cases like a retained admin seat, a manager who needs access only for reporting, or a contractor whose account should have been downgraded weeks ago.
Track usage at the seat level. Portfolio reviews get sharper when you stop treating one application as one number.
The missing APM metric for SaaS
Traditional APM talks a lot about app count, technical fit, and business value. It says much less about license utilization.
That gap matters because decentralized buying pushes 85% of SaaS spend outside IT oversight, according to Zylo’s application portfolio management strategy article. The same source notes that tools that automate idle seat detection can deliver 30-40% license cost reductions.
For Zendesk admins, that’s the difference between “we think we have waste” and “we know exactly which seats are idle.”
What useful Zendesk usage tracking looks like
A workable review usually checks:
- Inactive agents: enabled users with little or no recent operational activity
- Light-duty accounts: people who may not need a full paid seat
- Role drift: users whose current access no longer matches their job
- Temporary access creep: project users who stayed licensed after the work ended
- Redundant workflows: teams paying for another support-adjacent tool while Zendesk already covers the need
One practical example. On Suite Growth at $89 per agent/month, even a small number of inactive seats adds up quickly because the waste repeats every month. You don’t need a huge environment for it to matter.
What works in real teams
The best process I’ve seen is boring on purpose.
Run a monthly or quarterly usage audit. Put each user into one of four buckets: active, needs review, downgrade candidate, remove. Send the exception list to the support manager, not the full roster. Make changes before the renewal window, not during it.
What fails is the annual scramble. By then, the org chart changed, memory is fuzzy, and everyone defaults to keeping access “just in case.”
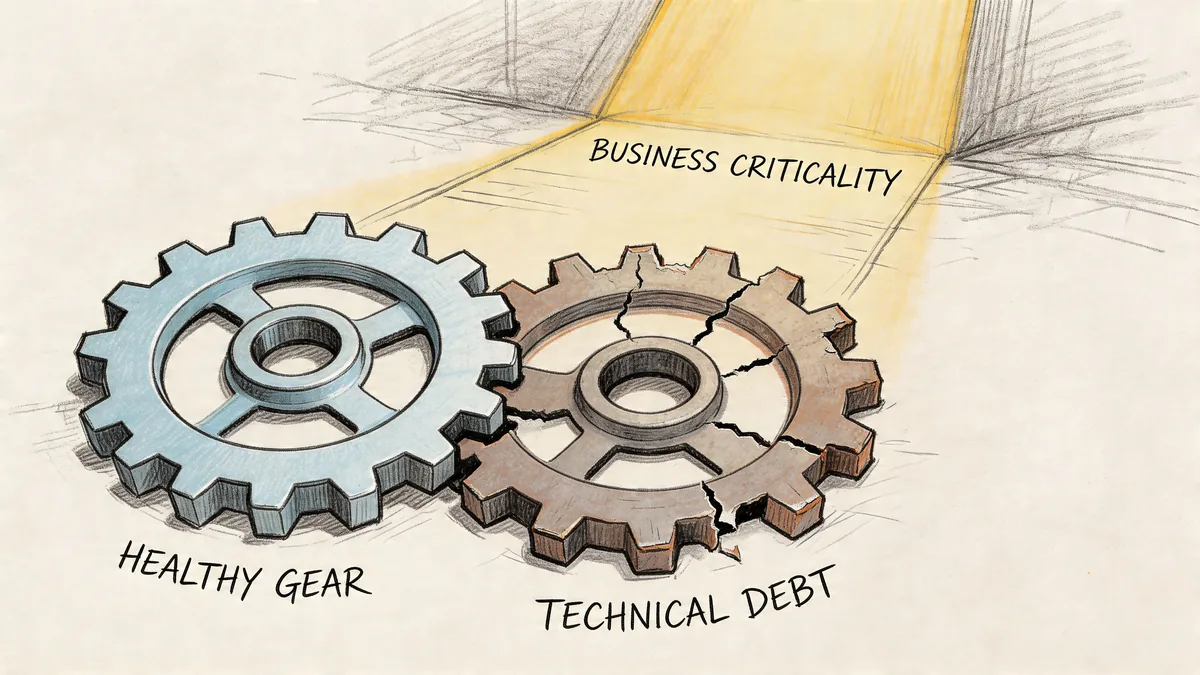
Operational Metrics Technical Health and Business Criticality
A Zendesk instance can show modest usage in one report and still be tied to a process nobody wants to disrupt. I have seen teams mark an app as expendable because login activity looked light, then learn it handled escalations, audit requests, or a workflow that only shows up when something goes wrong.
That is why operational metrics sit beside cost and license utilization, not underneath them.
Start with technical health
Technical health is the fast way to spot hidden support burden.
Mid-market teams do not need a full architecture review for every SaaS tool. A short scorecard is usually enough to separate stable apps from the ones that keep creating admin work. Use a 1 to 5 scale and rate each application on a few areas that matter in day-to-day operations:
- Vendor reliability: the product is maintained, support responds, and the roadmap still looks active
- Integration fit: the app connects cleanly to the rest of your stack without brittle workarounds
- Admin burden: normal changes do not require specialist effort every time
- Change friction: updates, configuration changes, and permission changes stay controlled
- Visibility: ownership, usage, and basic operational behavior are easy to verify
Low technical health does not automatically mean removal. It often means contain the sprawl, stop expanding usage, and line up a replacement at renewal.
That distinction matters.
A shaky app with low usage can still drain time if every permissions change turns into a support ticket. In a Zendesk environment, I would score not just the core platform but also the add-ons around it. The side reporting tool, the niche quality plugin, the old integration someone built two years ago. Those are often where technical debt hides.
Then score business criticality
The second question is simpler. If this app is unavailable for one business day, what breaks?
IT should not answer that alone. Ask the support manager, operations lead, finance owner, or department head who depends on the workflow. Their answer usually reveals whether the app is important or just familiar.
A simple rubric keeps the conversation grounded:
| Score | Business criticality |
|---|---|
| 1 | Nice to have |
| 2 | Helpful, but work continues |
| 3 | Important for team efficiency |
| 4 | Daily operations take a hit without it |
| 5 | Work stops or customer impact is immediate |
Zendesk itself often scores high because customer support runs through it all day. The tools around Zendesk usually deserve a harder look. A dashboard add-on may feel important because a few power users rely on it, but that is different from being business-critical. If tickets still get routed, solved, and reported on without it, the score should come down.
The best retirement decisions happen when these two scores are reviewed together. Quiet app, low criticality, weak technical health, clear substitute. That is an easier call. Quiet app, high criticality, messy configuration, no substitute. That needs a migration plan, not a cancellation email.
Why app count still matters
As noted earlier, large portfolios create more redundancy and more maintenance drag. Mid-market teams feel the same pattern at a smaller scale.
Every extra app adds another owner to track, another admin surface to review, another renewal date, another integration, and another place where user access can drift. Consequently, SaaS sprawl stops being an abstract APM problem and becomes weekly operational friction.
Zendesk is a good example. One company may have Zendesk, a separate chatbot tool, a survey add-on, a reporting layer, a knowledge base product the marketing team bought, and a small workflow app that duplicates triggers Zendesk already handles. None of those subscriptions looks dramatic on its own. Together they create overlap, fragmented ownership, and more places to miss unused licenses.
The trade-off teams miss
Technical health and business criticality rarely line up neatly.
Some old tools are painful to administer but still support revenue or customer operations. Some modern tools are easy to manage and barely matter. APM works when the scorecard leaves room for both facts and forces a decision based on real operating conditions, not preference.
That is the practical value of operational metrics. They keep teams from cutting the wrong app and help them focus cleanup work where it will reduce support burden, contract waste, and avoidable complexity.
Risk Metrics Measuring What Could Go Wrong
Every portfolio review needs a risk view, even when the immediate goal is cost control.
Cheap software can still be expensive if it creates security exposure, compliance trouble, or a hidden dependency nobody documented.
Score risk in three parts
A practical app risk score can be built from three lenses.
Security risk looks at whether the app supports your access standards and whether its setup is acceptable for the data involved. In a Zendesk-connected workflow, that includes basics like access control, admin hygiene, and whether old accounts are hanging around longer than they should.
Compliance risk asks where data lives, who can access it, and whether the app fits your company’s obligations. If legal, privacy, or procurement teams have never reviewed it, that’s a signal on its own.
Dependency risk is the one many teams miss. If an app goes offline, what breaks next? Which exports stop, which teams lose visibility, which workflows fail undetected?
| Risk area | Good question to ask |
|---|---|
| Security | Are old users removed quickly, and is access controlled well enough |
| Compliance | Do we know what data sits there and who approved it |
| Dependency | What downstream work fails if this app is unavailable |
Interdependencies change the decision
A lot of bad APM decisions come from looking at one app in isolation.
Traditional APM metrics often miss interdependencies, and retiring one app can disrupt workflows and create new risks. Bizzdesign’s discussion of APM also notes that predictive analytics can help forecast license needs and identify 20-30% potential savings from proactive downgrades.
That matters in Zendesk environments because support tooling rarely stands alone. Ticketing, chat, knowledge base workflows, reporting, QA tools, and escalation paths all connect in ways that are obvious only after something breaks.
A practical way to review risk
Use a short workshop, not a long form.
Pull in one Zendesk admin, one support lead, and one person from IT or security. Review your top apps and ask:
- What data does the app hold
- Who can grant access
- How are inactive users found
- What breaks if it’s unavailable
- What tool depends on it upstream or downstream
If nobody can answer those cleanly, the risk score should go up.
What works better than a giant assessment
Quarterly light-touch reviews beat annual heavy reviews.
Risk changes when teams reorganize, vendors update products, or new integrations appear. You won’t catch that in a once-a-year document nobody reopens. A shorter recurring review keeps the portfolio grounded in current reality.
What to Do Before Your Next SaaS Renewal
Many organizations don’t need a giant APM program. They need a repeatable review process that survives a busy quarter.
Start with your most expensive or messy tools. Zendesk is usually on that list.
Use this quarterly checklist
Build the inventory
List the app, owner, contract date, renewal date, and primary team. If you don’t have a full inventory, start with your top five software costs.
Run four scores
Capture cost, usage, technical health, and business criticality. Add a risk note if the app touches sensitive data or key workflows.
Sort with TIME
Put each app in tolerate, invest, migrate, or eliminate. Don’t overthink the label. The point is to force a decision.
Act before renewal
Remove stale seats, downgrade where appropriate, cancel overlapping tools, and assign follow-up work for apps you’re keeping.
Repeat on a schedule
Quarterly is enough for most mid-market teams. Annual reviews are too late.
Keep the process small enough to finish
A review that takes weeks won’t happen regularly.
What works is a lean operating rhythm:
- One owner: someone is accountable for the app data
- One page per app: no giant workbook
- One meeting: decisions, not status theater
- One deadline: changes made before the vendor quote arrives
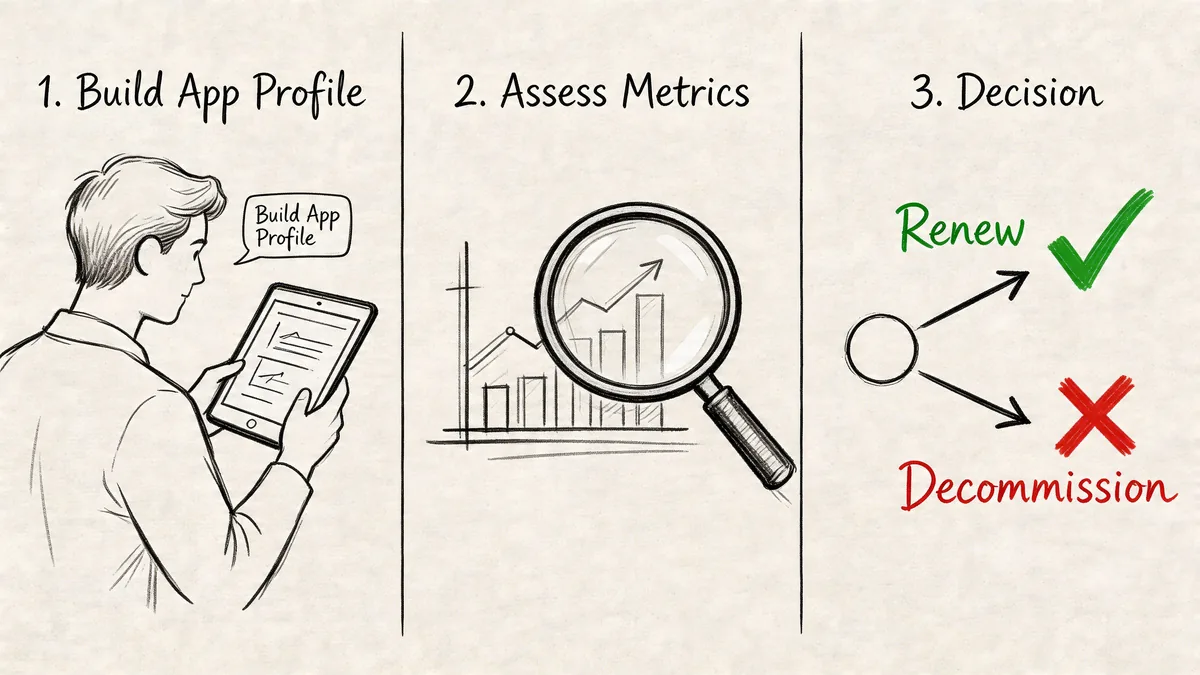
Here’s a short explainer that shows the lifecycle thinking in action.
The end goal
You want to walk into renewal season with evidence, not guesses.
If finance asks why Zendesk costs what it does, you should be able to say who uses it, which seats are questionable, what the platform supports, and what actions are already queued. That’s what application portfolio management metrics are for. Not reporting. Better renewal decisions.
If you want a faster way to spot wasted Zendesk spend, LicenseTrim connects through Zendesk OAuth with read-only access, flags inactive agents, and shows the cost of unused licenses before renewal. It’s a practical shortcut when you want seat-level evidence without another spreadsheet audit.